The Securities House recognizes the importance of international real estate sector as it has always been a safe asset class. We mainly focus on rewarding investment opportunities and provide our clients with distinctive returns.
Since 2017, The Securities House distinguished itself in the field of structuring and syndicating yielding real estate investment opportunities with medium-term duration in the international markets, especially in the United States.
International Yielding Real Estate Investments
Investment Strategy
Strategic partnerships with renowned real estate development and management partners who have acquired, developed and/or managed over $6 billion in industrial real estate throughout the United States, the United Kingdom and Europe.
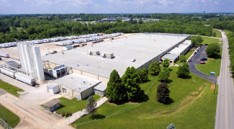
Industrial real estate is a large, stable, and diversified investment class that offers a compelling opportunity for both current income and appreciation investors across an array of industrial property types serving various uses.
Acquisition of core plus, mission critical real estate properties in prime industrial sub-markets with no premiums paid, thus minimizing value risk.
Acquired properties are fully leased on a long-term basis to investment-grade and/or credit quality tenants, thus ensuring the generation stable rental revenue.
Investment horizon of between 3-5 years through selling the properties and the realization of attractive returns.
Ownership through offshore non-recourse special purpose vehicles to minimize taxable income and maximize Investor returns.
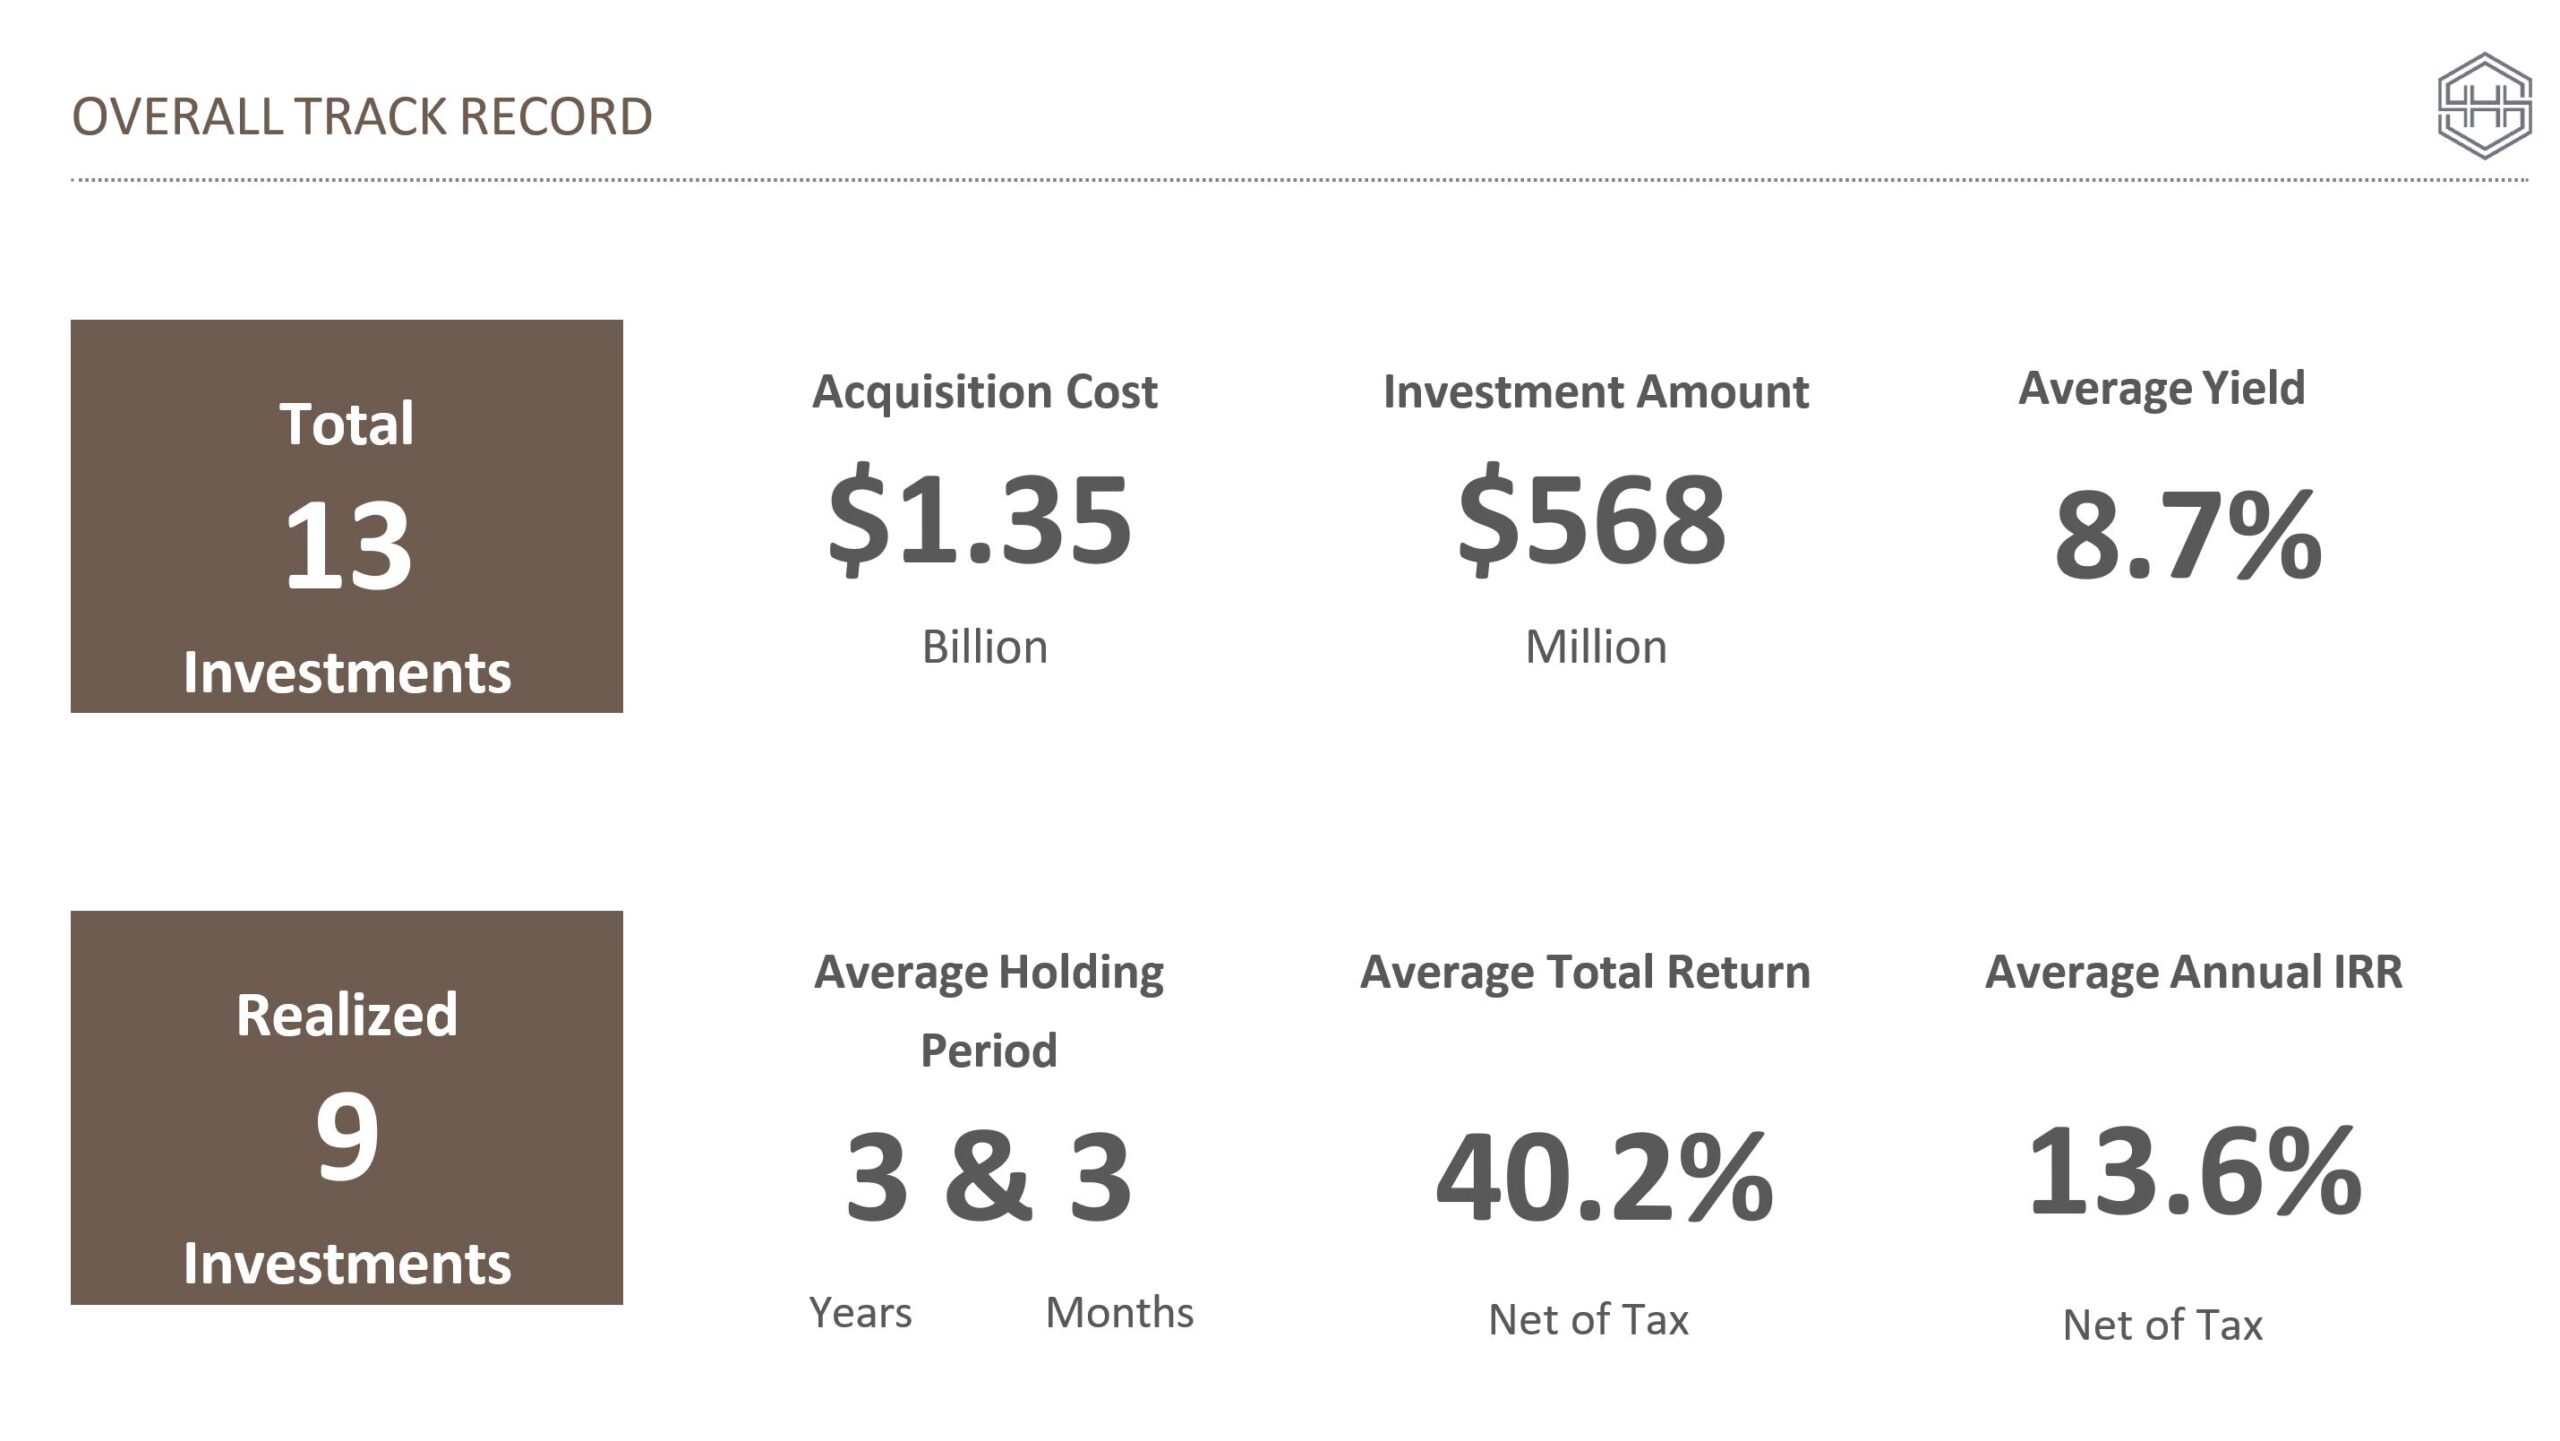
Overall Track Record
Portfolio and Track Record
1. Rolls Royce, UK
April 2011 – February 2014
Realized
Number of Properties
1
Net Built-up Area
542,000 SF
Acquisition Cost
£51,700,000
Investment Amount
£19,700,000
Target
Holding Period
5 Years
Distribution Yield
8.0%
Annual IRR (net of tax)
10.0%
Total Return (net of tax)
29.0%
Actual
Holding Period
2y & 10m
Distribution Yield
8.0%
Annual IRR (net of tax)
10.3%
Total Return (net of tax)
31.3%
2. USIP, USA
June 2012 – August 2014
Realized
Number of Properties
24
Net Built-up Area
3,400,00 SF
Acquisition Cost
$163,800,000
Investment Amount
$59,700,000
Target
Holding Period
5 Years
Distribution Yield
8.0%
Annual IRR (net of tax)
10.0%
Total Return (net of tax)
51.0%
Actual
Holding Period
2y & 2m
Distribution Yield
9.0%
Annual IRR (net of tax)
14.1%
Total Return (net of tax)
29.2%
3. USIP II, USA
June 2012 – August 2014
Realized
Number of Properties
21
Net Built-up Area
4,000,000 SF
Acquisition Cost
$183,900,000
Investment Amount
$67,600,000
Target
Holding Period
5 Years
Distribution Yield
8.0%
Annual IRR (net of tax)
10.0%
Total Return (net of tax)
50.0%
Actual
Holding Period
2y & 2m
Distribution Yield
9.0%
Annual IRR (net of tax)
16.3%
Total Return (net of tax)
28.1%
4. USIP III, USA
July 2013 – October 2017
Realized
Number of Properties
26
Net Built-up Area
3,500,000 SF
Acquisition Cost
$160,800,000
Investment Amount
$58,500,000
Target
Holding Period
5 Years
Distribution Yield
8.0%
Annual IRR (net of tax)
9.0%
Total Return (net of tax)
45.0%
Actual
Holding Period
4y & 3m
Distribution Yield
9.0%
Annual IRR (net of tax)
10.4%
Total Return (net of tax)
43.3%
5. USIPA, USA
August 2014 – March 2018
Realized
Number of Properties
6
Net Built-up Area
2,700,000 SF
Acquisition Cost
$128,000,000
Investment Amount
$56,084,000
Target
Holding Period
5 Years
Distribution Yield
8.0%
Annual IRR (net of tax)
9.0%
Total Return (net of tax)
46.0%
Actual
Holding Period
3y & 7m
Distribution Yield
8.9%
Annual IRR (net of tax)
10.6%
Total Return (net of tax)
31.1%
6. Omega, UK
September 2014 – December 2017
Realized
Number of Properties
1
Net Built-up Area
315,000 SF
Acquisition Cost
£17,500,000
Investment Amount
£17,500,000
Target
Holding Period
5 Years
Distribution Yield
8.0%
Annual IRR (net of tax)
7.0%
Total Return (net of tax)
20.0%
Actual
Holding Period
3y & 3m
Distribution Yield
6.5%
Annual IRR (net of tax)
15.8%
Total Return (net of tax)
37.9%
7. USIPA II, USA June 2017
Number of Properties
7
Net Built-up Area
3,460,000 SF
Acquisition Cost
$138,400,000
Investment Amount
$61,400,000
Target
Holding Period
5 Years
Distribution Yield
8.0%
Annual IRR (net of tax)
9.0%
Total Return (net of tax)
46.5%
Actual
Distribution Yield
8.75%
8. SIP, USA
September 2017 – December 2022
Realized
Number of Properties
11
Net Built-up Area
2,500,000 SF
Acquisition Cost
$105,000,000
Investment Amount
$42,400,000
Target
Holding Period
5 Years
Distribution Yield
8.0%
Annual IRR (net of tax)
10.0%
Total Return (net of tax)
51.0%
Actual
Holding Period
5y & 3m
Distribution Yield
9.25%
Annual IRR (net of tax)
13.0%
Total Return (net of tax)
63.8%
9. Bluelinx, USA
January 2018 – April 2021
Realized
Number of Properties
4
Net Built-up Area
2,150,000 SF
Acquisition Cost
$113,800,000
Investment Amount
$44,550,000
Target
Holding Period
5 Years
Distribution Yield
8.0%
Annual IRR (net of tax)
9.0%
Total Return (net of tax)
45.0%
Actual
Holding Period
3y & 3m
Distribution Yield
9.5%
Annual IRR (net of tax)
15.6%
Total Return (net of tax)
56.6%
10. USIPA III, USA
June 2019 – February 2022
Realized